Simon Caufield in London writes:
“If you’re a Monty Python fan, you may remember the Dennis Moore sketch from 1970. He was a kind-of mixed up Dick Turpin character who stole from the poor to give to the rich. And that’s exactly what Mervyn King, Ben Bernanke and Mario Draghi [of the European Central Bank] are doing today.
“Each has his own version of quantitative easing (QE). Mervyn prints money to buy gilts from bond investors. Ben prints money to buy government bonds directly from banks. Mario prints money to allow banks to buy government bonds. And the banks must post them as collateral with their National Central Banks (NCBs). But the sovereigns can’t repay. And the banks are undercapitalised. So, in effect, the NCBs own the bonds just like the Bank of England and the Fed.
“In all three variations of QE, the central banks are buying government bonds that are worth way less than the price they’re paying. And they’re buying them from financial institutions. In effect, they’re subsidising anyone who sells their overvalued bonds back to the central banks. That means banks, insurers, pension funds and wealthy investors.
“Who pays the subsidy? Well, the central banks would bear the losses initially. But ordinary tax payers provide capital to the central banks. You don’t hear much about this today, but you will. If the economy recovers, the central banks will have to sell their bonds to manage inflation. By then, bond yields will be higher. So they’ll take a loss on every bond they sell. If they have to sell a lot of bonds, and the losses are large, they’ll need to raise more capital. That can only come via government from taxpayers.
“If the central banks don’t sell enough bonds, inflation could get out of control. So everyone will bear the cost of central banks’ subsidising the rich in the form of higher prices.
“The TV news is full of stories about social unrest on the streets of Athens. I’m surprised there’s no revolt by savers and tax payers in London, Berlin and Washington…”
*** Buy gold and buy sound currencies …
Simon is recommending readers of his True Value letter buy sound currencies and gold to protect themselves the inflation he sees coming. In his latest issue, he writes:
“Gold is the soundest currency of them all. It can’t be printed. It’s not controlled by a heavily-indebted government. Owning gold does not expose you to counterparty risk. And right now, it’s a good substitute for stocks. They’re rising, despite being overvalued, because the central banks are printing money. Well, gold gives us a similar exposure – but it’s not overvalued.”

Tuesday, 28 February 2012
Monday, 27 February 2012
Greece is far from being Europe’s only problem
I don’t know about you, but I try to avoid giving binding commitments at 2:00 in the morning. Agreeing to anything important when you’re that tired and grumpy and had that much to drink is just asking for trouble.
Yet European leaders seem to be in the habit of concluding big bail-out deals in the wee small hours. It’s the ‘last negotiator standing’ tactic. Everyone gets so fed up and tired and has invested so much time and energy that they’ll agree to anything, just to get back to bed.
And that’s how, this morning, Greece was saved – again.
Greek citizens can look forward to years of grinding austerity and resenting Germans. Their debtors can look forward to writing off even more of their debts in the not-too-distant future.
But Europe is intact. And that’s what matters. Isn’t it?
Yet another ‘make-or-break’ moment for Greece
“Everyone understood that this was the moment of truth”, said Belgian finance minister Steven Vanackere at this morning’s Greek deal press conference.
Maybe ‘truth’ has a different meaning in Belgium. We’ve seen so many ‘moments of truth’ in the eurozone crisis that we’ve lost count. So what’s the latest one all about?
Greece is to get €130bn in aid. This is all meant to get Greece past a big bond redemption (in other words, when it’s due to repay a load of its debt) next month. Private sector bondholders have agreed to swap the bonds they hold now, for new ones. This will involve a ‘haircut’ of 53.5% on the face value of the bonds, up from the 50% agreed in October. They’re also set to get a lower interest rate on the new bonds than they’d previously hoped.
In exchange, Greece has agreed another €325m in spending cuts. There will be a permanent team of monitors in Athens, watching the nation’s finances. Greece will have to hold three months’ worth of debt payments in an escrow account, to make sure it prioritises paying off its debts and doesn’t blow the lot.
Here’s where the problems start. After every ‘grand package’ announced by Europe, the loose ends are quickly revealed, and just as quickly, start to unravel. As noted above, that’s because these ‘deals’ are agreed at 2:00 in the morning, when no one is in a fit state to commit to anything.
Firstly, private sector bondholders need to agree to swap their bonds for the new ones. Secondly, Greece needs to suck up yet more austerity – so if there’s anything flammable left in Athens, don’t expect it to be there for much longer. Thirdly, every other government in the eurozone needs to approve the deal too.
Assuming this does all get passed, then Greece won’t go bust next month, hopefully. But the chances of it ever getting back to any sort of sustainable debt position under current circumstances are frankly non-existent. The best-case scenario is for debt-to-GDP to come in at 120.5% by 2020. That’s if everything goes according to plan.
But do markets care?
So Greece is still doomed to default. It’s just a matter of time. But do markets really care anymore? The bail-out news didn’t make much difference to them, which suggests they’d already priced it in – or that they simply weren’t worried, regardless of the outcome.
Perhaps that’s understandable. Mario Draghi at the European Central Bank (ECB) has made it clear that he won’t allow banks to run out of money on his watch. The ECB is effectively doing quantitative easing, whether it admits it or not.
So chances are, we’re not going to have a Lehman Brothers moment in the eurozone. Banks have now had long enough to offload their exposure to Greece, and any other weak links, onto the ECB (and ultimately, the German taxpayer). And the ECB has shown that just like every other developed world central bank, it’s happy to print money. Hence the recent rally.
But we’d be wary of getting too excited about all this. Politics is of course, always going to be an issue. The markets are currently pricing in a ‘muddle-through’ scenario, where there’s the occasional hiccup, but the ECB smoothes everything over by printing money when needed.
If Greece gets fed up and votes for an anti-Europe party; or Germany does the same; or any of the other 15 countries in the eurozone do something similar; panic could return. And if the ECB becomes more hesitant about printing money, that’d probably be even worse.
But the real problem for now – as Ferguson noted – is that the European economy is going to endure a miserable time as banks embark on a much-delayed repairing of their balance sheets. This is a project that British and American banks started on far earlier than Europe’s did. And we’ve hardly had a pleasant few years.
With Europe’s banking system tightening credit, and the economy shrinking, that has to have a knock-on effect to the rest of the world, not least of all China.
Gold And Silver Way Off Inflation-Adjusted Highs
I think it is laughable when analysts go on television and claim that precious metals are in a bubble that is about to pop: "Get out of this barbarous relic while you still can!"
These same people claimed that gold at $800, $1,000 and $1,500 were tops as well. If these sages keep at it, they will get it right eventually, but I suspect it will be another three to four years before this occurs. In my view, the precious metals bull market still has a long way to go and the current consolidation is offering an excellent opportunity to load up the boat.
There are many ways to judge if an asset class is in a bubble. One of the key measures is investor participation, or in our case, the percentage of global assets invested in gold or gold mining shares. While this percentage has historically been above 20%, it is currently estimated to be around 2%. There is no widespread public participation in the gold market, and plenty of naysayers that argue against gold as an investment at every opportunity. I’d be upset too if I was sitting on negative real gains in the stock market over the past decade while the gold price has quadrupled! The bottom line is that with participation this thin, any talk of gold being in a bubble is premature. For those of you that are more visual in nature, this graph should help:
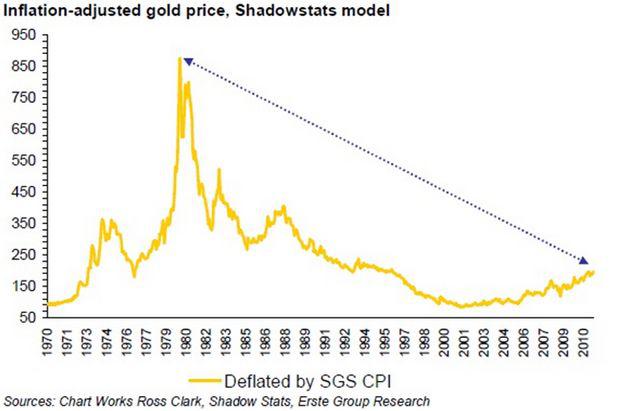
Another easy way to demonstrate that gold is not in a bubble is to look at the inflation-adjusted highs. The nominal highs for gold and silver occurred during January of 1980, when gold topped out at $850 and silver at $49.45. Official government inflation statistics tell us that in today’s dollar terms, gold would need to reach $2,500 and silver $150 before matching their true 1980 highs. But it is well known that the government significantly understates the inflation rate in order to mask the impact of their fiscal policies.
John Williams, the economist behind the website Shadow Stats, has done us the favor of stripping out the government gimmicks in order to derive the true inflation rate over the past thirty years. Using his SGS-Alternate Consumer Inflation Measure, gold would need to reach $8,890 per troy ounce and silver would need to reach $517 per troy ounce to match the highs from January of 1980.
Bubble?
When considering that the conditions which propelled gold and silver to their 1980 highs are much worse today, I predict both metals will easily eclipse those previous highs. That means $2,500 gold and $150 silver at the very minimum, but more likely a parabolic ascent to $8,890 gold and $517 silver before all is said and done.
It seems rather absurd then to talk about the precious metals bull market being over at this juncture. Gold is trading at just $1,750, still needing to advance 43% to reach $2,500 and more than 400% to reach the true inflation-adjusted high of $8,890.
Even more dramatic is the potential return for silver between now and the final parabolic top. With silver trading at just $33, it would need to climb 355% to reach its official inflation-adjusted high and a whopping 1467% to reach its true inflation-adjusted high!
Unless you believe that governments worldwide are suddenly going to get their debt situations under control and immediately return to being fiscally prudent, investing in precious metals seem as close as you can get to a sure thing. A huge amount of wealth is going to be transferred from those holding fiat paper to those holding real money. It has already been an immensely profitable ride over the past 10 years, but I am convinced it is not too late to jump on board for the next major upleg.
If gold reaching $8,890 is still a difficult pill for you to swallow, consider that gold expert Mike Maloney has run calculations showing that if history repeats and gold covers the same portion of the currency supply that it did in 1934 and 1980, we should see prices of at least $15,000 per ounce. Furthermore, he believes this will occur within the next 3 to 5 years, suddenly making the inflation-adjusted target of $8,890 seem rather tame.
No matter which measure you use, it is easy to conclude that gold and silver have much higher to go before their bubble is fully inflated and ready to pop. When your family, your neighbors, the coffee barista, the taxi driver and most financial advisors are suddenly talking about the premium to spot price for silver eagles or the high grade intercepts of their favorite Canadian junior, it might be time to consider exiting your position. But until then, it is nothing more than hot air when these so called analysts get on CNBC and claim the bull market in gold and silver is over.
While I advocate owning physical metal in your possession first, some of the greatest gains can often be realized by investing in undervalued mining companies. Their profit margins shoot dramatically higher as the prices of gold and silver climb, often providing excellent leverage to the advance of the underlying metal. In particular, I believe that junior miners are significantly undervalued at the current moment and will produce some truly astronomical gains going forward.
Friday, 24 February 2012
Why is diesel price so high?
I was driving my diesel car up the motorway listening to Radio 5, when the AA report on fuel prices came out. The average price of diesel at the pump has just gone to a new high, 143.05p a litre.
This came just a few days after we were told that inflation was falling.
A lot of people were upset – and understandably so. High fuel prices drive up the cost of doing business and the cost of living.
Experts and callers all chimed in with suggestions as to why the price is so high – excessive duty, supply constraints in Europe, refinery problems, the weakness of the pound against the dollar, price fixing, tensions in the straits of Hormuz.
There’s something to all of these.
But not one person mentioned the elephant in the room. It’s an elephant that I keep coming back to. Verging-on-the-unaffordable diesel is yet another consequence of the deliberate policy of governments and central banks to devalue money…
Why is the diesel price so high?
There are certain mysteries surrounding the diesel price. Why is diesel more expensive than petrol, when it used to be the opposite? Doesn’t diesel require less refining than petrol and less crude oil to produce – so shouldn’t it therefore be cheaper? And how come diesel’s cheaper than petrol on the continent in, say, France?
A commonly cited answer for this is tax and, yes, the high cost of diesel has plenty to do with tax. Some 75% of your £1.43 goes straight into the pocket of our glorious government, which then uses it to invest in things like NHS IT systems or RBS.
But tax doesn’t explain the relative expense of diesel. The UK duty rate for the road fuels is the same, whether it’s unleaded petrol, diesel, biodiesel or bioethanol.
On the continent, however, various diesel subsidies in certain countries have led to the discrepancy in prices.
As for refining, there are some misconceptions. Old-fashioned diesel requires less crude oil to produce, and less refining than petrol. Hence the heavy clouds of black smoke you used to see behind a bus or a lorry.
But the modern ‘clean’ variant – ultra-low sulphur diesel, made to modern established standards, and now the norm – requires a more complex refining process. You can refine less ultra–low sulphur diesel from a barrel of crude than you can petrol, unless you use some extremely expensive refining processes.
There have also been issues at the Coryton refinery in Essex, leading to a slight disruption in supply.
Neither petrol nor diesel are terribly transparent markets. The price ranges quite considerably by area, for example. Some supermarkets even sell diesel at a small loss, just to get punters onto the premises. When you get these discrepancies and lack of transparencies, paranoid theories always start to emerge – many of them to do with price fixing – and many of them wrong.
But the fact is that refining, location, pricing are all normal market forces. And they’re not going to change prices by more than a few pennies – 5% maybe or, in extreme cases, 10%.
The bottom line is that – regardless of what fuel you’re using – it has become very expensive to fill up your tank. I’m not sure people really mind that diesel is more expensive than petrol – they just mind the fact that both are expensive. And both, ultimately, are driven by the price of oil.
Oil prices have rocketed – measured in pounds sterling, at least
If you look at a chart of oil since 1999, and ignore the speculative excess of 2008, the broader trend is not hard to see. Oil, whether crude or heating, is in a long-term bull market. Here is the US dollar price of Brent crude since 1994.
This bull market is partly driven by declining supplies and increased demand. Global oil production peaked in May 2005 and despite the higher price, this level of production has not been matched.
The fact that companies are now having to drill miles under the sea or in other undesirable locations, suggests that the easy–to–find ‘cheap’ stuff has long since been found. There may be something to this peak oil business after all.
But even this can’t account for the whole story. After all, the supply of oil has not fallen by that much. A few percent maybe. The real difference is in the supply of money – which has rocketed.
Here is a chart of Brent, priced in pounds. You can see the oil price is above the 2008 highs. From the late 1998 low of £5.77 to the current price around £75.50 is a move of around 1,308%. Blimey!
A technician might look at that chart and declare that the 2008 high – £75 or so a barrel – will now become support. In other words, these high prices are here to stay. We’ll see.
Now let’s look at a long–term chart of Brent priced in gold. In other words – how much gold does it take to buy a barrel of Brent?
Gold, of course, cannot be devalued to anything like the same extent as governments’ own issue. And we see that the oil price is the same as it was in 1996.
It’s 0.02 of an ounce (50%) more expensive than it was at the extreme lows of 1999, and it’s 0.07 of an ounce (50%) cheaper than it was at the extreme highs of 2008.
The price fluctuates, yes. It should. That is normal. But there has been nothing like the same range of movement as with pounds, where oil has enjoyed that 1,300% move. How much easier would it be to plan and run a business, a home or indeed an economy, with a more stable money such as this?
I have no doubt that oil companies, petrol stations, refineries and any other company operating in the diesel market are all trying to make as much money out of you as they can. But there’s only so much they can charge before the customer goes elsewhere.
The real reason the diesel price is so unaffordable is that modern money is being systematically debased to bail out the profligate, be it the government, the banks or anyone else who has spent more than they can afford.
And you can brace yourself for more of the same.
Tuesday, 21 February 2012
How will an Israeli-Iranian war effect global markets?
War between Israel and Iran now seems inevitable. Leon Panetta claimed that it would be this coming spring—and I see no reason to doubt him.
How an Israeli-Iranian war will play out—that is, whether it will draw in more geopolitical actors (such as the U.S.), or if it will be a series of limited attacks, counter-attacks, and then stalemate—is impossible to predict. War tends to take on a life of its own.
But we can predict how it will affect the global markets.
A very reasonable assumption is that oil supplies, especially to Europe, will be severely curtailed. Aside from the fact that one fifth of the world’s oil production passes through the Straight of Hormuz—ground zero of a war with Iran—the rest of the world and especially Europe depends on Iranian oil. As discussed in the SPG Scenario of this past June (“An Israeli-Iranian War?”), close to 10% of the eurozone’s oil comes from Iran—and the countries most particularly dependent on Iranian oil are precisely those most in trouble right now: The so-called PIIGS.
So oil prices will inevitably rise. And so—just like 1979, after the overthrow of the Shah of Iran and the subsequent Oil Shock—the world’s economies will experience another likely oil shock which will send up the price of oil, hurting the world economies rather badly—
—and driving up inflation.
Dollar inflation and euro inflation is in the offing, in the weeks and months following a war with Iran. The assets that will rise drastically in price will be precious metals, especially silver; agricultural commodities; and oil—obviously. The assets that will collapse in price will be sovereign bonds, corporate bonds, and equities, in that order. In the Scenario, I discussed which countries will hurt the most, so I won’t bother repeating what I wrote there.
However, notice I say that inflation will rise “in the weeks and month following a war with Iran”: A war with Iran which disrupts oil supplies will—inevitably—lead to an inflationary wave.
But before that inflationary wave hits—that is, in the days and hours following the beginning of the war—we will experience a deflationary undertow.
This deflationary undertow will present some interesting opportunities.
If and when there is a curtailment of Iranian oil due to a war in the region, inflationary expectations and a regular ol’ short-squeeze—paradoxically—would force both the dollar and the euro up, as traders and speculators sell off assets and positions and go to cash in those two currencies, in order to cover their exposure.
That is, as the markets digest the news of war with Iran and the subsequent disruption of the global oil supply, there would be a rush to cash before a reallocation of capital in the global markets.
This is the deflationary undertow that we can expect immediately following war breaking out with Iran.
How severe will this deflationary undertow be? It will depend on how expectant the world markets are.
The more build-up to the war in the mainstream media, the lesser the deflationary undertow. If a majority of market participants come to the conclusion that war with Iran is inevitable, and thus reallocate their capital before the war, then market panic following the outbreak of hostilities will be at a minimum: Therefore, the less severe and strenuous the reallocation of capital following the beginning of the war. Oil prices would of course go up—but there wouldn’t be a generalized market disruption and panic.
This, of course, is predicated on there being a steady drum beat to war.
If a war with Iran is sudden and unexpected, the market reaction would accordingly be more violent—more short-term deflationary.
As an example of this deflationary undertow, consider the period June–December of 2008, with respect to gold: Gold peaked at $930 on June 30, just before the Global Financial Crisis, only to fall all the way down to just below $730 on September 11, when the financial panic was at its peak. Then gold rose once more to over $900 by September 25—only to collapse to just below $700 on October 11: A yo-yoing of 23% up, and then 22% down, in exactly one month.
Why such huge swings? Uncertainty.
There is no question that there will be a deflationary undertow immediately following the start of war with Iran. This would mean a fall in the prices of precious metals and all other commodities (except of course oil), before the markets realized that rises in the price of oil mean widespread inflation of both the dollar and the euro, and thus a rebound and rise in the prices of precious metals.
The real question is, Will this deflationary undertow before the inflationary wave hits be severe? Or minor? Or barely a blip, before we shoot the inflationary moon?
It will depend on how prepared market participants are. The more priced-in the expectations of war, the less potent the deflationary undertow.
So watch the mainstream media, and keep an ear on the zeitgeist. The more mainstream discussion about the inevitability of war, the less the deflationary undertow.
Keep in mind: I am not arguing that a war with Iran would be deflationary—not at all. War with Iran, and the curtailment of global oil supplies, would be radically inflationary. I am saying that the immediate, near term effect of a war with Iran could potentially be severely deflationary, if global markets are caught flat footed.
This deflationary spasm of a few days (a couple of weeks at most) before inflationary expectations set in and drive precious metals and commodity prices a lot higher could be the perfect buying opportunity—if you’re prepared.
Monday, 20 February 2012
Where we part company with Warren Buffett...
Here’s the Sage of Omaha, explaining, in Fortune magazine, why bonds are dangerous:
Investments that are denominated in a given currency include money-market funds, bonds, mortgages, bank deposits, and other instruments. Most of these currency-based investments are thought of as "safe." In truth they are among the most dangerous of assets. Their beta may be zero, but their risk is huge.
Over the past century these instruments have destroyed the purchasing power of investors in many countries, even as these holders continued to receive timely payments of interest and principal. This ugly result, moreover, will forever recur. Governments determine the ultimate value of money, and systemic forces will sometimes cause them to gravitate to policies that produce inflation. From time to time such policies spin out of control.
Even in the U.S., where the wish for a stable currency is strong, the dollar has fallen a staggering 86% in value since 1965, when I took over management of Berkshire. It takes no less than $7 today to buy what $1 did at that time. Consequently, a tax-free institution would have needed 4.3% interest annually from bond investments over that period to simply maintain its purchasing power. Its managers would have been kidding themselves if they thought of any portion of that interest as "income."
For taxpaying investors like you and me, the picture has been far worse. During the same 47-year period, continuous rolling of U.S. Treasury bills produced 5.7% annually. That sounds satisfactory. But if an individual investor paid personal income taxes at a rate averaging 25%, this 5.7% return would have yielded nothing in the way of real income. This investor's visible income tax would have stripped him of 1.4 points of the stated yield, and the invisible inflation tax would have devoured the remaining 4.3 points. It's noteworthy that the implicit inflation "tax" was more than triple the explicit income tax that our investor probably thought of as his main burden. "In God We Trust" may be imprinted on our currency, but the hand that activates our government's printing press has been all too human.
High interest rates, of course, can compensate purchasers for the inflation risk they face with currency-based investments -- and indeed, rates in the early 1980s did that job nicely. Current rates, however, do not come close to offsetting the purchasing-power risk that investors assume. Right now bonds should come with a warning label.
Under today's conditions, therefore, I do not like currency-based investments.
Buffett goes on to explain why he doesn’t like gold either. He points out that since 1965 the total return on gold (not adjusted for inflation) was 4,455%. But the total return on stocks was higher, at 6,072%.
The difference between the two is that gold is a ‘sterile’ investment, says Buffett. Stocks are not.
He’s right. Gold is only useful at protecting purchasing power when the monetary system is in danger. At almost all other times, you’re better off with stocks... businesses... farmland or another productive asset.
That’s why Buffett now prefers stocks. And it is why we now prefer gold.
Buffett willingly gives up the protection of gold in order to the get the upside from stocks. We willingly give up the upside from stocks in order to get the protection from gold.
Who’s right?
Only time will tell. Our guess is that time will tell us that Buffett is right... in the near term. But we’re still not going to switch to stocks. Because the risk is too high that time will be on our side.
In other words, the most likely outcome... as far as we can tell... is that the financial world will stumble along more or less in the same direction it is going now. Perhaps for many years. Gold, already expensive in terms of purchasing power, may go nowhere... or even down. After all, we’re still in a Great Correction. As long as we follow in Japan’s footsteps there’s no particular reason for gold to rise.
But we do not bet on the most likely outcome. We bet on the outcome that is underpriced. The outcome that is most likely to pay off... or blow us up. In our view, investors do not yet fully appreciate the risks of a financial catastrophe, a war or a revolution.
In the news, we learned that hundreds of thousands of Greeks had taken to the streets. “Rioters burn buildings... ” reports Bloomberg:
Feb. 12 (Bloomberg) -- Rioters set fire to buildings and battled police in downtown Athens as the Greek Parliament prepared to vote on Prime Minister Lucas Papademos’s austerity package to avert the nation’s collapse.
Ten fires were burning in central Athens including buildings housing a Starbucks Corp. cafe, a bank and a movie theater, a fire department spokesman said, speaking on the condition of anonymity in line with official policy. The blazes were near a bank that was set on fire in May 2010, killing three bank employees, during a general strike against Greece’s first bailout package.
The Greek Parliament must send a message,” Finance Minister Evangelos Venizelos told lawmakers in Athens as the final debate on the accord to secure a 130 billion-euro ($171 billion) second aid package got under way. “We must show that Greeks, when they are called on to choose between the bad and the worst, choose the bad to avoid the worst.”
“We are seeing Athens go up in flames again,” Mayor George Kaminis, said in an interview on ANT1 television. “This must stop. What they are trying to do to Athens is what they are trying to do to the entire country.”
Meanwhile, hardly a day passes that we don’t hear of an impending attack on Iran.
The developed economies are borrowing money at two to five times the rate of GDP growth.
And the world’s major central banks eagerly print money.
Maybe Buffett will be right. Maybe the next 47 years will be like the last. But it seems like a bad bet to us. All the key circumstances are completely different – even opposite.
You remember the years from ’65 to 2012. They weren’t perfect. But they weren’t bad. The US was on top of the world... and headed higher. It was owed more money by more people than any nation ever had been. It was the leading energy exporter. It was the world’s leading capital investor. Its people were earning more and more money – in real terms. Total consumer and government, as a percentage of GDP, was barely a fifth of today’s level.
Of course, it wasn’t all good. The US was getting deeper and deeper into a costly and losing war. This would lead to some big bills to pay in the ‘70s... and to some tough times. But, overall, America’s best days were still ahead.
And today?
Now, the emerging markets are growing much faster... taking more and more market share from the US. America is deep in debt... and adding more debt every day. Major industries have been zombified. More than half the voters depend on money from the government. America’s degenerate capitalism... and its geriatric democracy cannot adapt to the challenges it faces. And the typical working man hasn’t had a real increase in wages since the Johnson administration.
In ’65, the US was heading for glory. In ’12, it may be going to Hell.
But who knows? Maybe Buffett will be right.
Still... we’ll stick to our formula.
Buy gold on dips. Sell stocks on rallies.
Thursday, 16 February 2012
Waiting out the great correction
Before the great depression millions of Americans were still not completely caught up in the money economy. Many still lived on the land. They kept pigs and chickens. They tended their own gardens and “put up” their own canned goods. They cut their own wood to heat their houses. They pumped water from their own wells. Many still made their own clothes.
When the Depression came, they could hunker down and wait it out.
But today, the developed world is in a Great Correction. And it shows no sign of coming to an end. Japan is already in a slump that has lasted – off and on – longer than most marriages. Europe is headed into a slump – with half of all young people jobless in many countries. And in the US, at this stage in a typical recession/recovery cycle, the economy should be growing at an 8% rate. Instead, growth is below 2%.
Why? This is no typical recession/recovery cycle. Instead, the private sector is cutting back on debt. At the present, household debt is going down (mostly via mortgage foreclosures) at about 5% of GDP per year.
At this rate, it could take ten years or more to get household debt down to more comfortable levels, say, around 70% of disposable income.
But the average household can’t wait ten years for the de-leveraging to do its work. Heck, it can’t even wait two months. Both parents work. They’ve got two cars. And two mortgages. Money in; money out. 24/7...
No garden. No firewood. No chickens. No time to wait. No time to sit still. Just bills... bills... bills...
They’ve got to work... they’ve got to earn money... they’ve got to spend...
They can’t do nothing.
Empires come and go. And in coming and going, they seem to be symmetrical. The way up takes about as long as the way down. The Roman Empire took hundreds of years to reach its peak and hundreds of years to go away. The Third Reich was supposed to last for 1,000 years, too. Instead, it lasted 12, with about eight years of expansion and four years of contraction.
The British Empire got underway with the conquest of Scotland and Ireland. One hundred years after the Battle of Culloden, which crushed the clans and sealed Scotland’s fate, the Brits ruled half the world. But 100 years later, their empire was mostly gone... with the US having taken away the imperial crown.
America’s empire could be said to have begun with the defeat of the South in the War Between the States. Or, perhaps with the invasion of the Philippines in 1899. It peaked in the early ‘70s... when US wages reached a top. Or, maybe in the ‘80s, when China began to compete with it and the US shifted from a creditor nation to a debtor. Now it is on the downward slope. In a few years, China will have the world’s biggest economy. A few years later, it will probably have the world’s dominant military force.
Will the decline be graceful and dignified? Or marked by bankruptcy, hyperinflation, war and shame?
John Kagan, writing in the Wall Street Journal, doesn’t think he will like it.
If and when American power declines, the institutions and norms that American power has supported will decline, too. Or more likely, if history is a guide, they may collapse altogether as we make a transition to another kind of world order, or to disorder. We may discover then that the U.S. was essential to keeping the present world order together and that the alternative to American power was not peace and harmony but chaos and catastrophe—which is what the world looked like right before the American order came into being.
We don’t know what will happen. But we doubt we will like it either.
Still, we’re not silly enough to think that the path to imperial decay can be blocked by our own willpower. Here’s Kagan again, delusional:
... international order is not an evolution; it is an imposition. It is the domination of one vision over others—in America's case, the domination of free-market and democratic principles, together with an international system that supports them. The present order will last only as long as those who favor it and benefit from it retain the will and capacity to defend it.
He seems to think that if an imperial power spends more money on its military industry it will somehow resist the tides and the winds. All of imperial history argues that he’s wrong.
When an empire’s time is up... it’s up.
Wednesday, 15 February 2012
How much Gold does it take to buy a house in Britain?
Why measure house prices in gold?
Every time I return to this topic, comments pop up questioning the validity of the exercise. You can’t buy houses with gold, runs the argument, so what’s the point of looking at the ratio of the two?
First, there are many who have wisely moved their wealth into gold to see out the current financial storm. They will move out of gold when they see relative value elsewhere. Hence the need to compare the price of gold to other markets.
Second, we are living in an age where money is being systematically, deliberately debased. This is not a conspiracy theory. The Bank of England is ignoring its stated duty, which is to keep inflation at 2%. Instead, it is issuing money out of nowhere and using it to buy bonds, in order to suppress long-term interest rates and ‘kick-start’ the economy. In other words, it is actually trying to create inflation.
In the case of the housing market, it hasn’t kick-started anything. In fact, it’s brought the market to a standstill. Savers and first-time buyers are left waiting on the sidelines for lower prices, watching their savings get eroded by inflation and in some cases, simply unable to secure a mortgage. Meanwhile debtors bask in the saver-subsidised cheap living provided by the Bank and its artificially low interest rates. Yet the Bank goes on printing.
If you look at the price of anything over the last 50 years – houses, food, energy, Western wages (not in real terms, but nominal) – you will see that it has gone up. This is down to our system of money – the supply of which is potentially limitless.
The only items where these endlessly rising prices are less evident are in areas such as computers and clothing that have benefitted from mass production, improved technology, and cheap labour in emerging markets.
I prefer not to use something that is being debased as my unit of account. I prefer something finite, which is why I like gold. New gold supply roughly matches world population growth – that makes it a much more natural form of money, or more natural unit of account at least.
Yes, you could use Mars bars, as one poster suggested in the past. But they do not have the weight of several thousand years of monetary history; they are less finite; and the data is harder to come by. So let’s stick with gold.
In gold terms, UK housing has fallen by just over 78% from its high of 725 ounces in 2005 to 156 ounces in January. It is below its lows of the early 1990s, but has not yet reached its lows of the early 1980s or 1930s (50-100 ounces for the average UK house) – where, by the way, I am convinced it will be in a few years’ time.
But the flood of foreign money has meant that in London the falls have been less pronounced – in fact, measured in sterling there have been rises. Get out of London if you want to find value, is the simple answer.
If London property was purely a reflection of what Londoners could pay, then prices would be lower. But it isn’t. What’s going to stop the flood of foreign buyers for London property? A dramatic rise in the pound is one possibility. But a quick £50bn in quantitative easing has just killed that possibility, although the pound does look strong against the euro.
Another 2008-style collapse? Possible, but don’t bank on it.
More likely is some change of legislation, a new tax maybe – a mansion tax, or a change in non-dom status, for example. I don’t know. But, to my knowledge, there is nothing in the pipeline.
Monday, 13 February 2012
A new reason why Gold will soar
There are a number of reasons why many of us believe gold stocks will shoot for the moon before this bull market is over – they've done so many times in the past… the gold price still has a long way to climb… and producers are generating record revenue and profits. But I think there's another reason why gold stocks will soar – one that hasn't dawned on many in the industry yet.
The premise for my theory first lies in how gold itself is viewed. Some investors see gold as strictly a commodity or the infamous "barbarous relic." This group sees no compelling reason to buy the metal and so own little to none. Others view it as a play on a rising asset or because of supply and demand imbalances; they buy while those reasons are positive and sell when they turn negative. Still others view gold as a store of value, an alternative currency, or a hedge against inflation; they tend to buy and hold.
Ask yourself why you own gold. Is it because it's just another asset that offers diversification? Are you buying because it's going up and someone like Doug Casey thinks it will continue doing so? Or is it due to a genuine concern about the dilution of your currency, both now and in the future?
What's interesting to note is the shift in the number of investors wanting exposure to gold. Many who ignored it a decade ago are now buying. Those who started buying, say, five years ago, continue purchasing it today in spite of paying twice what they paid then. Slowly but surely, it's becoming more important to more people. To wit, increasing numbers of investors are viewing gold as a must-own asset.
So, what happens when it becomes a must-own asset to a substantial majority instead of a small minority? Sure, the price will rise, probably parabolically, but putting aside speculation on the price of gold for now, have you thought about what happens if you have trouble finding any actual, physical gold to buy?
I think what many bullion dealers warned of regarding supply in last month's BIG GOLD could come true. Andy Schectman of Miles Franklin insisted that the bullion market "will ultimately be defined by complete lack of available supply." Border Gold's Michael Levy cautioned, "If an overwhelming loss of confidence in the US unfolds, the demand for physical gold and silver will far outweigh all known inventories." And Mike Maloney of GoldSilver.com warned that if shortages develop, "physical bullion coins and bars might become unobtainable regardless of price."
The population of planet Earth has grown roughly 15% just since the year 2000, while the new supply of gold from all sources (mining, scrap, de-hedging) has fallen 4.2%. The rate of growth in the world's population last year was 1.1%; while this is roughly similar to the increase in annual mine production for 2011, the trend right now is clearly for the growth in population to surpass the global supply of gold coming to market.
At the same time, demand keeps growing. China imported 3.3 million ounces of gold last November – and total global mining production outside China is just 6.4 million ounces per month. Gold bullion held by the world's central banks is at a six-year high – but it's roughly 15% below the amount they held in 1980 and has fallen in half as a percent of their total reserves.
Silver supply and demand paints an even starker picture: last year, for the first time in history, sales of silver Eagle and Maple Leaf coins surpassed domestic production in both the US and Canada. Throw in the fact that by most estimates less than 5% of the US population owns any gold or silver and you can see how precarious the situation is. A supply squeeze is not out of the question – rather it is coming to look more and more likely with each passing month.
This is great for gold owners and speculators, but it has further implications: As increasing numbers of people view gold as a must-own asset, and as supply is not keeping up with demand, where is the next logical place for investors to turn to get exposure?
Gold stocks.
Imagine the plight of the mainstream investor who calls a bullion dealer and is told they have no inventory and don't know when they'll get any. Picture those with wealth finally becoming convinced they must own precious metals and being informed they'll have to put their name on a waiting list. Imagine a pension fund or other institutional investor scrambling to get more metal for their fund and being advised the amount they want is "currently unavailable."
Make no mistake: if this bull market continues, gold stocks will truly soar. An increasingly desperate clamor for exposure to gold could light a short fuse for our market sector. It's not here yet, but when the rush starts, it will be both breathtaking and life-changing.
Friday, 10 February 2012
Silver Supply Inadequate To Meet Growing Demand
In the media much has been made of the investment demand for silver and whether or not it will maintain its blistering pace. So far, it has. Even if one were to make the argument that demand will remain flat, within commodities a bull market can thrive. This takes place when supply declines faster than demand—disrupting the fragile balance and igniting what we believe are the beginnings of a massive bull market.
In 2012, for January alone the U.S. mint sold 6,107,000 oz. of silver, after remaining stable throughout 1999-2007, averaging 9,400,000 oz. annually. In 2008, sales more than doubled, reaching 19,700,000 oz., and then another huge rise in sales to 34,700,000 oz. for 2010. In 2011 a fresh peak was set: 39,868,500 oz.! This is more silver than the United States produces as a nation, for the sole use of being fabricated into 1-ounce coins.
For the remaining silver needed for industrial and other purposes, the United States relies on imports. The January 2012 United States Geological Survey shows that U.S. reliance on silver imports has grown from 64% in 2007, up to a staggering 75% of U.S. consumption coming from overseas.
Subscribe to:
Comments (Atom)